![Toncoin [TON] price prediction – Watch out for THESE short-term targets!](https://i1.wp.com/ambcrypto.com/wp-content/uploads/2025/03/Toncoin-Featured-1-1000x600.webp?w=1920&resize=1920,1152&ssl=1 "Toncoin [TON] price prediction – Watch out for THESE short-term targets!")
- Toncoin’s daily chart had a bearish structure, but demand was stronger
- A breakout past $4 hasn’t been confirmed yet
Toncoin [TON], at the time of writing, seemed to be flashing a sell signal on the TD Sequential, according to crypto analyst Ali Martinez. This, after the price started trading under the pivotal $4 resistance zone.
A growth in Toncoin dApps could mean a resurgence in DeFi solutions across the network. Hence, the question – Could this boost demand for the token and drive the altcoin’s price higher?
Is Toncoin’s demand enough for a breakout?
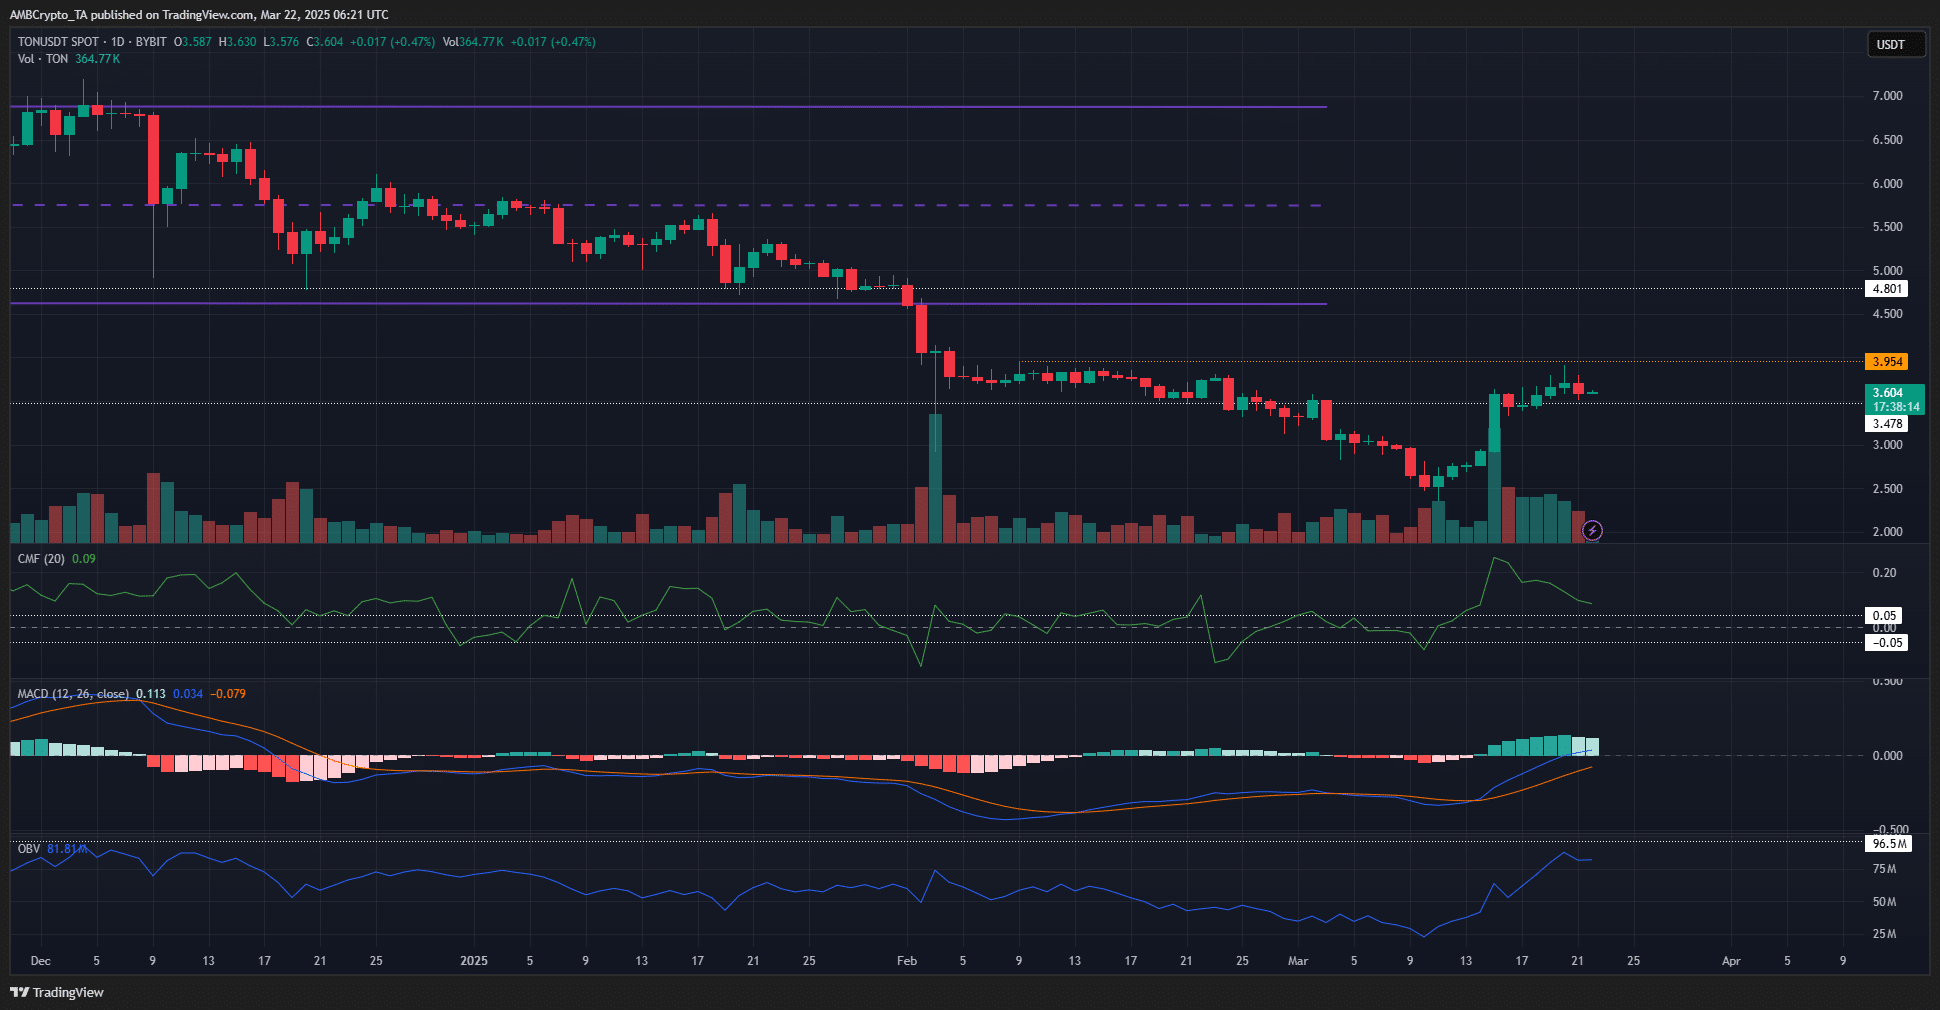
On the daily timeframe, Toncoin‘s market structure was bearish. And, the $3.95-level would be the one to beat to shift it bullishly. The chances of this happening appeared good too. Additionally, the volume indicators were on the bulls’ side.
At the time of writing, the CMF was above +0.05 to signal sizeable capital inflows. The OBV dramatically bounced higher over the past two weeks and seemed to be closing in on the highs from December. The MACD also noted a shift in momentum and at press time, was close to climbing past the zero mark.
Together, these indicators revealed that a breakout beyond $4 might be likely. TON bulls’ flip of the $3.47-level to support a week ago may be an encouraging sign as well.
Source: TON/USDT on TradingView
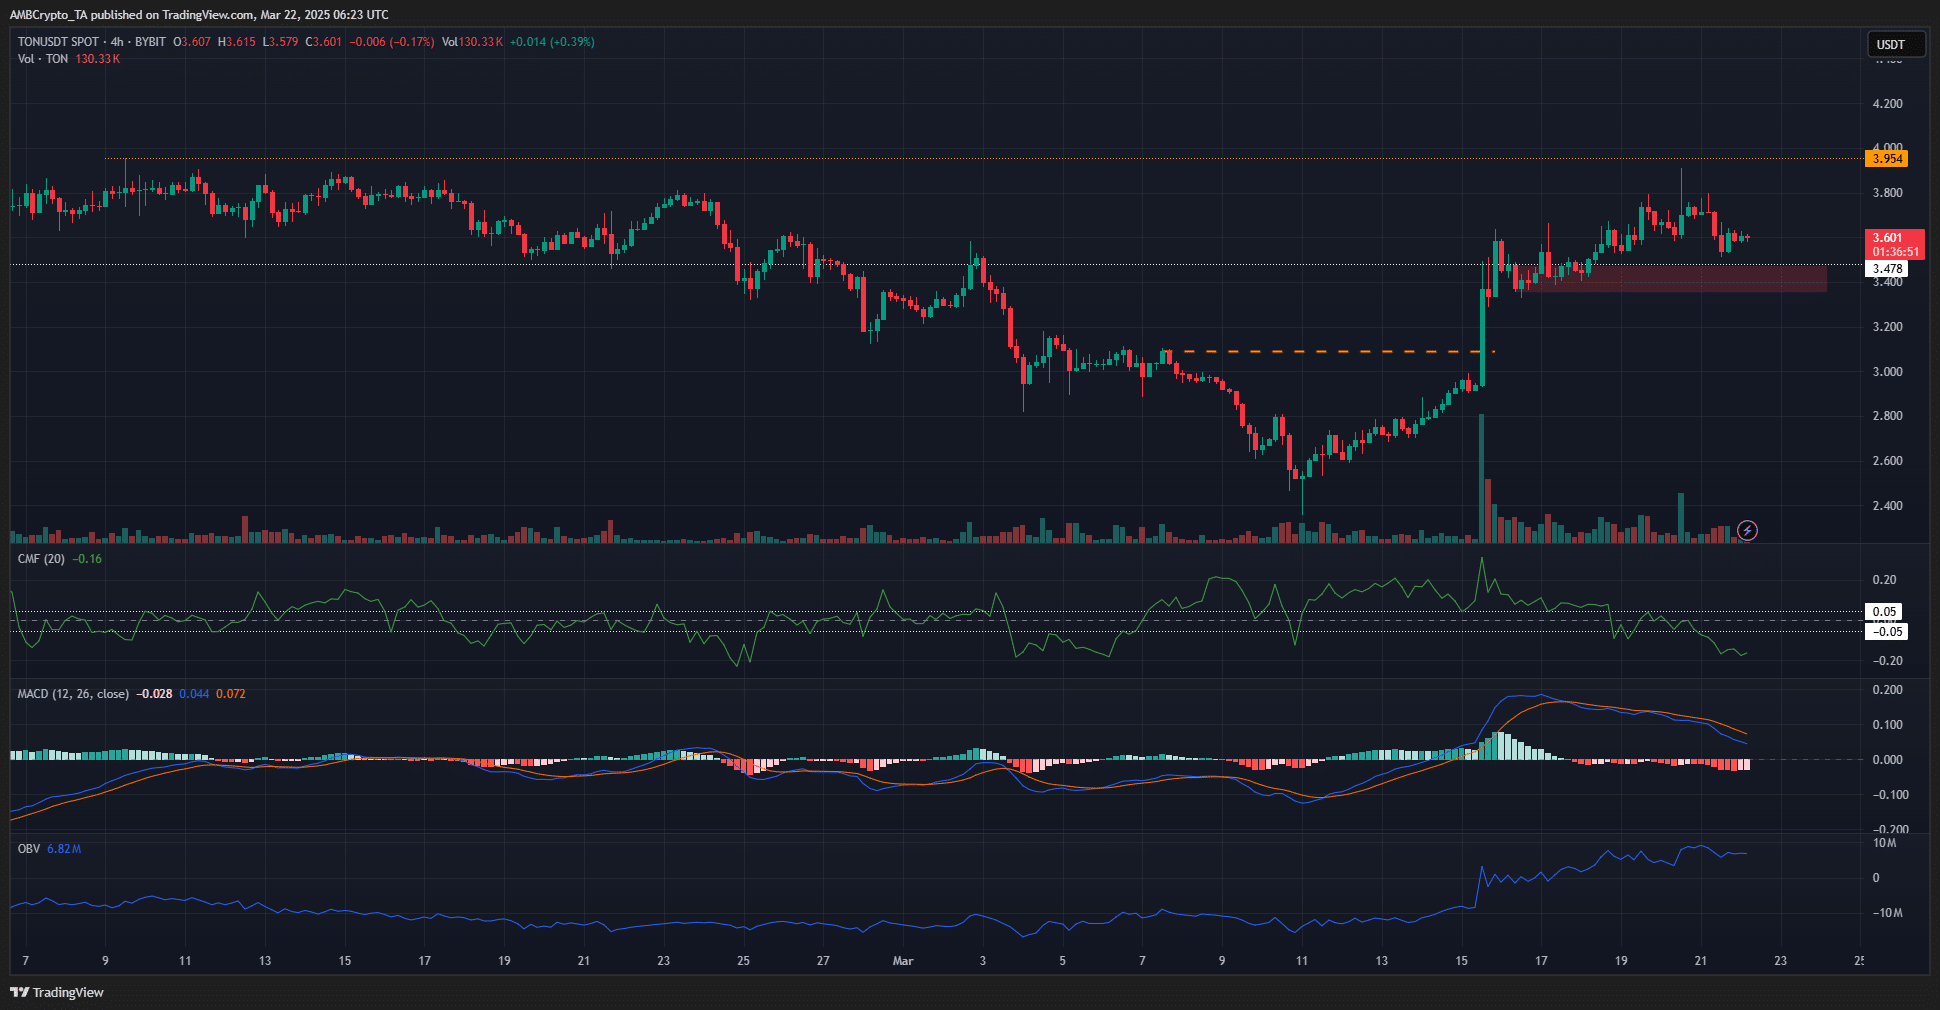
The 4-hour chart revealed that Toncoin’s capital inflows have slowed down lately. The CMF fell below -0.05. However, investors need not be disheartened. The OBV maintained its uptrend, although the MACD outlined weakened bullish momentum.
The market structure was bullish, and the $3.4-level emerged as a demand zone. A retest of this area would likely yield a price bounce. A move below this level could see TON retrace its recent gains.
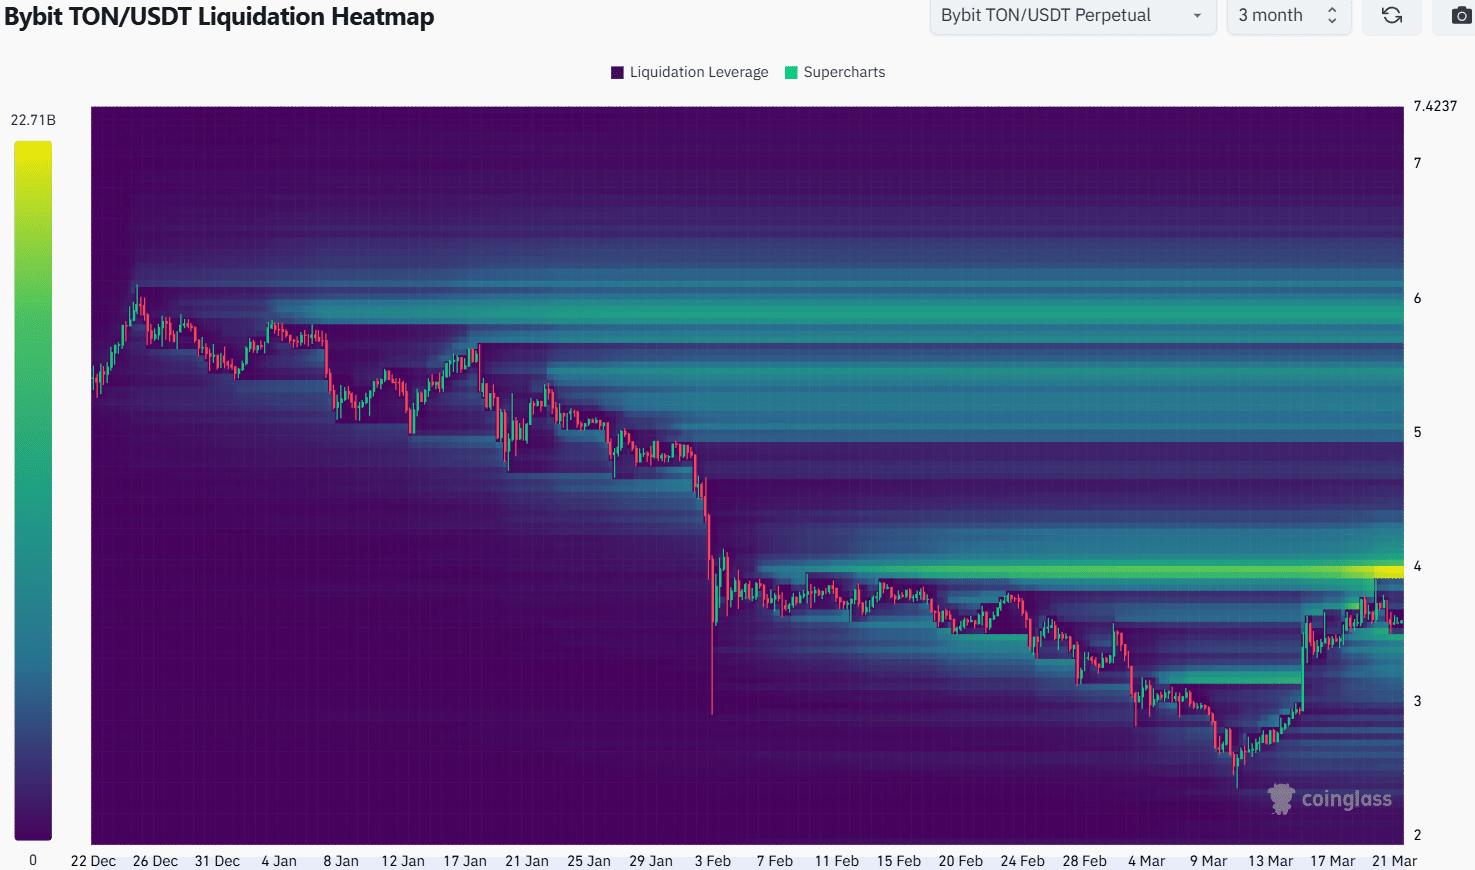
Source: Coinglass
The 3-month liquidation heatmap highlighted the $3.9-$4 region as a key magnetic zone.
Beyond this area, the $5.5 and $5.9 levels seemed to be the notable liquidity clusters. Hence, Toncoin’s reaction at $4 would be critical.
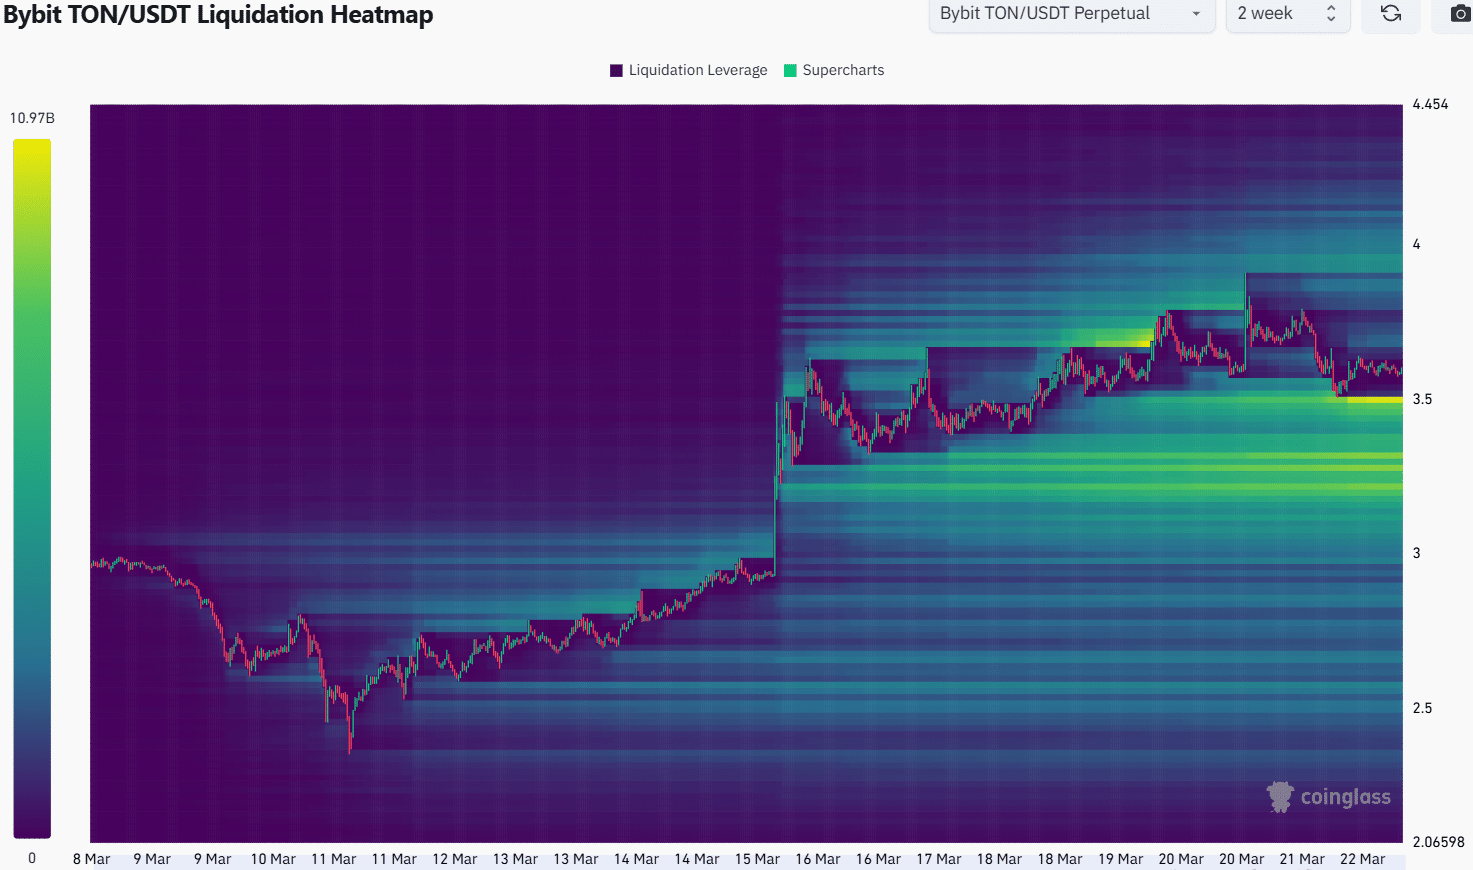
Source: Coinglass
Zooming into the 2-week heatmap, the $3.5 area contained a noticeable cluster of liquidation levels. It underlined a short-term downward magnetic zone for the price. Hence, TON traders can expect a dip to $3.4-$3.5 in the coming days.
The volume indicators on the 1-day chart underlined potential for a price rally. Hence, a drop to $3.5 would be a buying opportunity. Traders can take profits at $4, and wait for this level to be flipped to support before going long once again.
Disclaimer: The information presented does not constitute financial, investment, trading, or other types of advice and is solely the writer’s opinion